“The following material is extracted from work undertaken as part of the Composites Fire Performance project of Cooperative Research Centre for Advanced Composite Structures Ltd (CRC-ACS), established and supported under the Australian Government’s Cooperative Research Centres Program.”
Fire resistance is one of the key performance indices of a Passive Fire Protection (PFP) configuration.
It is determined by a furnace test in which a test specimen is exposed to the controlled temperature and pressure conditions of the furnace. Fire resistance is measured by the elapsed time for which the test specimen meets relevant performance criteria. For a non-load bearing PFP application, these criteria include fire integrity which requires that the test specimen maintains its separating function, and insulation performance which specifies the average temperature increase allowed on the unexposed surface of the specimen.
For PFP applications and construction elements, this allowable temperature increase is often specified as 140°C in relevant fire standards [6-7]. Assuming that a test specimen is originally at 20°C, the highest temperature on the unexposed surface of the specimen needs to be below 160°C to meet the insulation performance requirement.
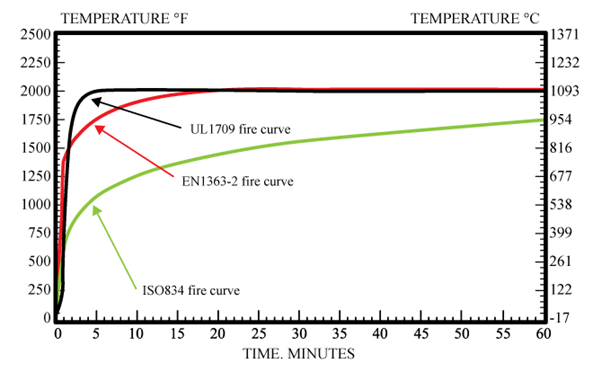
A number of standards have been developed for fire resistance tests. In each of the test standards, one of the key test parameters defined is the controlled time-temperature curve (fire curve) of the furnace. Figure 6 compares three of the most commonly used fire curves defined in ISO 834, EN 1363-2 and UL 1709 standards respectively.
The ISO 834 curve is generally considered to be representative of a cellulosic fire and has been adapted in many other standards, including AS 1530.4 [9] and EN 1363-1 [10]. It is also frequently quoted in ISO 13702 (PTS 80.80.00.11) [1] for various PFP applications on Oil, Gas and Petrochemical (OG&P) installations.
The fire curve is defined by the following equation:
T = 350log10 (8t + 1) + 20
where, T is the average furnace temperature in °C and t is time in minutes respectively.

Figure 6: Comparison of standard furnace fire curves.
As shown in Figure 6, temperatures defined in both the EN 1363-2 and UL 1709 curves increase at much faster rates, reaching approximately 1100°C within 30 minutes in EN 1363-2 and 5 minutes in UL 1709 respectively. Temperatures are then held constant for the rest of the test time. Both curves are specified to simulate hydrocarbon pool fires. The EN 1363-2 fire curve can be mathematically described by:
T =1080(1- 0.325e-0.167t – 0.675e-0.25t)+ 20
No mathematical equation has been given to the UL 1709 fire cure, which is specified directly by discrete data points.

Table 5: Furnace temperatures at different times (°C)
Table 5 lists temperatures given at different times by the three fire curves. It shows that temperatures defined by ISO 834 exceed those defined by the other two standards after approximately three hours of heating.
It should be noted that the fire curve is generally not the only key test parameter specified for a furnace test. For example, the furnace pressure needs to be controlled in an ISO 834 test whilst a heat flux is also specified in UL 1709.